Welcome!
This platform aims to provide accurate spatial information of the fishing pressure of Danish fisheries with bottom-towed gears, to support science-based management of the Danish waters.
It shows the spatial distribution and intensity of all bottom-towed gears used by Danish fishermen and provides quantitative fishing pressure indicators as advised by the International Council for the Exploration of the Sea (ICES). Note that the platform only provides spatial and temporal information of the direct, physical contact between the fishing gears and the seabed; the actual impact on the benthic community and seafloor status, and any indirect impacts of the fisheries (e.g. fish population status, or resuspension of sediments), are not included in the tool or accounted for.
Using the tab 'Map' you can select your ICES area(s), year, and fishing gear(s) of interest, for which the spatial distribution is shown in a map, and the fishing pressure indicators are given in a table. Under the tab 'Areas of interest', special attention is given to Natura-2000 areas and off-shore wind farms. Explanations of the outputs, how these are estimated, and the specifications of the different fishing gears are summarized in the 'Information' menu.
In version 2 we now present the multi-year footprint, in line with the D6C2 descriptor of fishing pressure on the seabed under the Marine Strategy Framework Directive. This represents our best estimate of how much of the seabed has physically been affected by Danish fishing gears during the assessed period. The multiyear footprints are calculated for both the overall area of interest and per habitat type. An explanation of its calculation is given under 'Fishing Pressure Indicators' under the information tab.
This page is currently under development and subject to frequent updates.
This webpage is designed by the National Institute of Aquatic Resources (DTU Aqua), within the EMFF project 'Dansk Fisker-Forsker Netværk 3. Fase', which is a collaboration of DTU Aqua with the Danish Fishermen’s Producer Organization (DFPO).


Please, feel free to contact us if you have questions or comments on this webpage. See the relevant email addresses underneath.
kjova@aqua.dtu.dk
Webpage developer within DTU Aqua.
hl@dkfish.dk
Contact person within DFPO.
Select the area, gear and year of interest and press 'Submit my selection'. The corresponding fishing intensity will then be shown on the map and in the table.
Select the area(s):
Select the gear(s):
Otter trawls
(OT)
Dredges
Beam trawls
(BT)
Demersal seines
Select the year:
Map
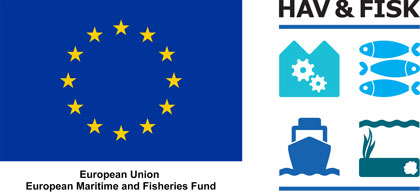
This map shows the annual fishing effort of the selected gears and year in the selected area. It can also show the national waters (EEZ), the official regional areas as defined by ICES (ICES Areas), and the international fishing effort (IFE) of all demersal gears combined over the year 2020. You can choose to co-display the Broad Habitat Types as defined under the Marine Strategy Framework Directive (MSFD), or the water depth (Depth). The legends for these layers can be found by clicking the corresponding button below the map.
Loading...
Table
This table shows the annual Swept Area Ratio (SAR) and the Percentage Unfished Area (PUA) for the selected area, for all demersal fishing gears combined and for the selected gears separately. The numbers represent the annual values. Please see the 'Fishing pressure indices' tab for information on their calculations.
International fishing effort
This table shows the annual Swept Area Ratio (SAR) and the Percentage Unfished Area (PUA) of the international fishing effort for the selected gears and year in the selected area. The data is based on the ICES-VMS call for the OSPAR advice.
Find more detailed fishing information on special areas, like Natura-2000 sites.
Select the year:
Select the gear(s):
The table underneath only shows fishing activity indicators for the selected gears and year inside the selected area. So, the displayed fishing activity outside of the selected site is not included in this table. The table shows the annual Swept Area Ratio (SAR) and the Percentage Unfished Area (PUA) for the selected year, gears, and area. Please see the 'Fishing pressure indices' tab for information on their calculations.
Loading...
Loading...
We here present a multi-year fishing footprint, in line with the D6C2 descriptor of fishing pressure on the seabed under the Marine Strategy Framework Directive. For the Danish Exclusive Economic Zone, we estimated the individual footprints of all Danish vessels fishing with mobile bottom-contacting gears. These individual footprints were then combined to determine the multiyear footprint, which represents our best estimate of how much of the seabed has physically been affected by fishing gear during the assessed period. The multiyear footprints are calculated for both the overall area of interest and per habitat type.
The footprint data shown on this page can be downloaded as GIS-layers here .
This map shows the multiyear footprint over the selected period. Note that the fishing footprint is determined at the very high resolution of 0.001 degree (ca 100 x 60 meter), but that the plotted resolution varies with the zooming level of the map.
Loading...
For the selected time period and area, this table presents the various habitat types that are present (both in absolute values and as % of the overall area) and how much of these habitats have been physically affected by mobile bottom-contacting gears.
This graph shows for each year within the selected period, and for all years combined, the percentage of the selected area that is fished, including the distribution of fished area over the different habitat types present.
Fishing pressure is expressed according to ICES indicators 1 and 3: the Swept Area Ratio (SAR) and the Percentage Unfished Area (PUA). A description of their calculation is given underneath.
The Swept Area Ratio (SAR) presents the ratio between the area (m2) swept by fishing gears within a grid cell, and the surface area (m2) of that grid cell (here: 100 x 100 meters). Hence, a SAR of 1 means that an area equally sized as the grid cell is fished. SAR less than 1 means less area is fished, and a SAR larger than 1 means that more area is fished. Note that this indicator displays the average fishing intensity; even with a SAR larger than 1, some spots can remain unfished.
Trawling tracks
Swept Area Ratio (SAR)
Trawling tracks
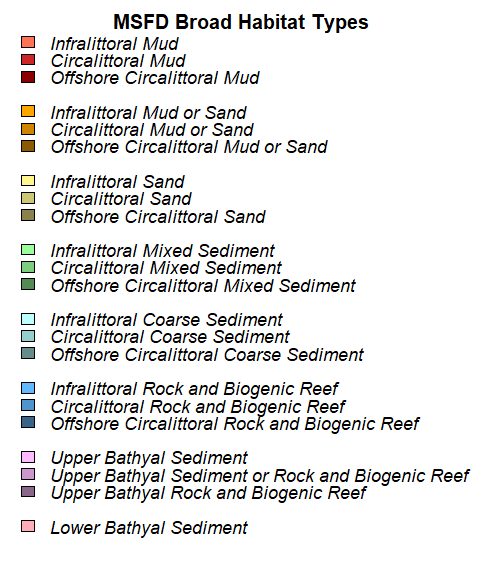
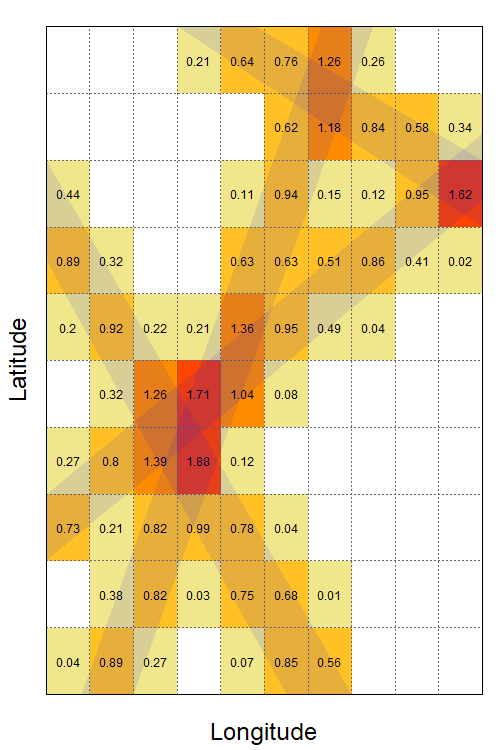
We will use this hypothetical example to explain how the fishing pressure indicators are calculated. In the figure you see a gridded area, with four trawling tracks depicted in blue. Some tracks overlap, and most of the area is not trawled.
Swept Area Ratio (SAR)
We calculated the swept area ratio for each grid cell in the example. They range from 0 to 1.88. Some cells are thus unfished, while others are fished more than once a year. However, you can see from the actual trawling tracks that no single grid cell has all its surface area fished; not even the grid cells with the highest SAR.
Conclusions
The average fishing intensity (SAR) for the entire area is 0.37. This estimate includes all grid cells, both fished and non-fished.
The average fishing intensity (SAR) for the fishing grounds is 0.61. This estimate is restricted to the fished grid cells. This is the average SAR estimate presented in this online tool.
The Percentage Unfished Area (PUA) represents the minimum extent of the area that is not fished. In this, we take into account that some grid cells are only partially fished. However, spatial overlap of fishing tracks (within a grid cell) is not taken into account. The PUA estimate is therefore a conservative estimate of the area that is unfished.
Trawling tracks
Percentage Unfished Area (PUA)

Trawling tracks
We will use this hypothetical example to explain how the fishing pressure indicators are calculated. In the figure you see a gridded area, with four trawling tracks depicted in blue. Some tracks overlap, and most of the area is not trawled.
Percentage Unfished Area (PUA)
To determine the PUA, we first calculate the fished area as the sum of all SAR-values (for all grid cells). SAR-values >1 are set to 1, as these grid cells are assumed to be fully fished. Grid cells that are only partly fished (0 < SAR < 1), contribute the proportion that they are fished.
Conclusions
In this example, a minimum of 66.3 % of the area is not fished.
That is a much higher percentage than if this indicator is calculated at the spatial resolution of full grid cells, which would result in an estimate of 39 % of the area being not fished.
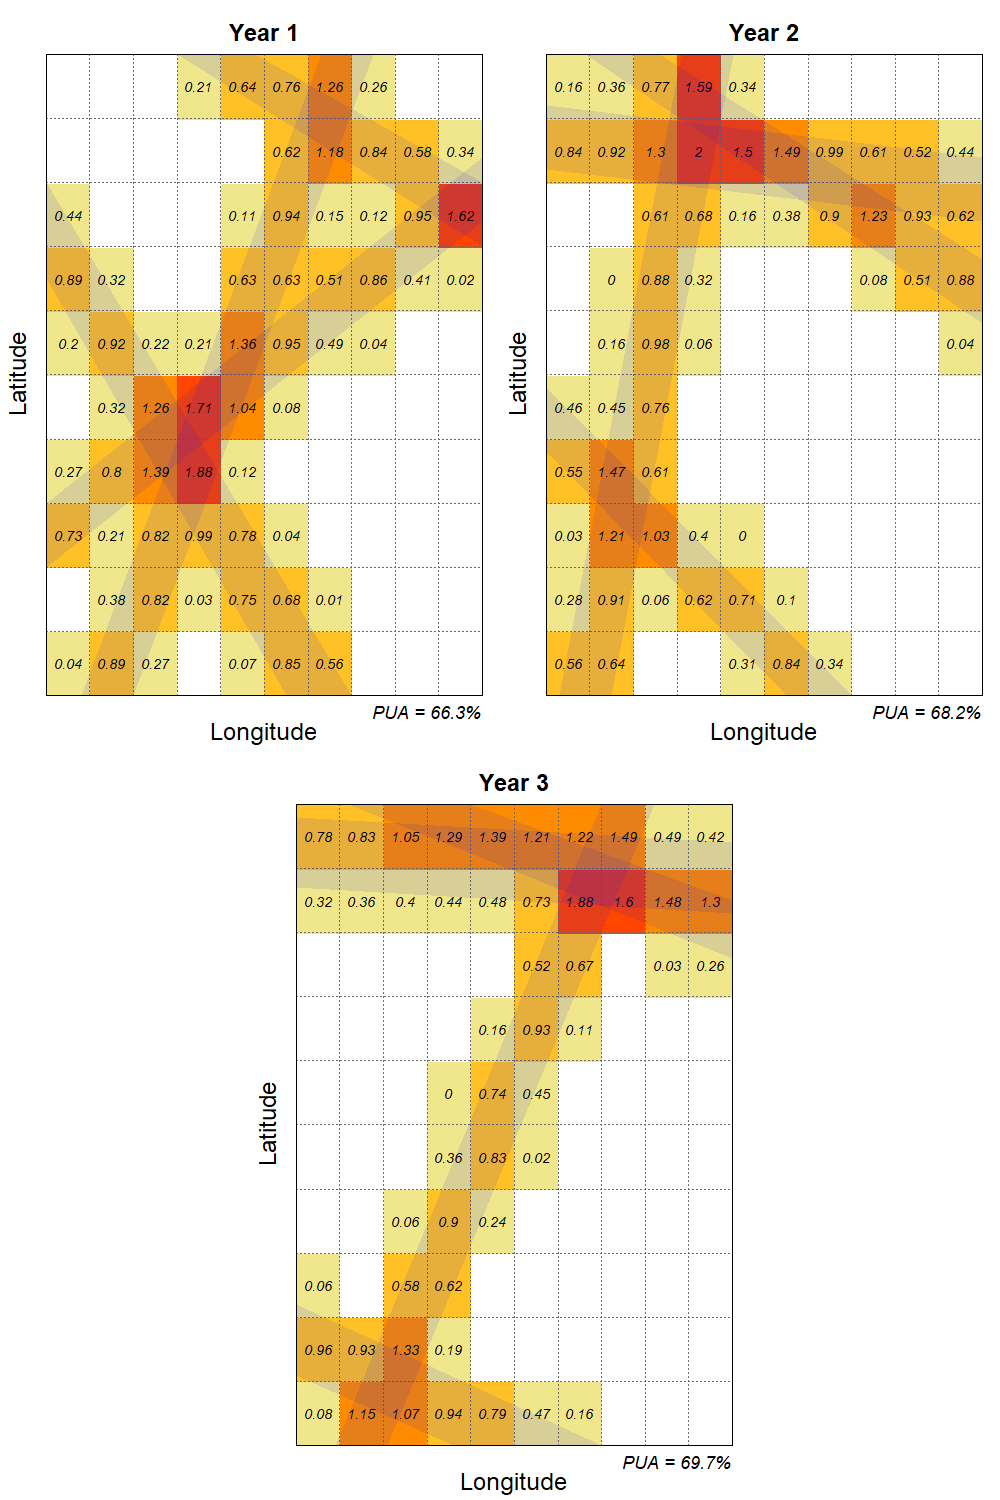
When the Percentage Unfished Area (PUA) is calculated for a multi-year period, the key step is to combine the yearly SAR values to determine the overall fisheries footprint. The multi-year PUA is then calculated from this overall footprint in the same way as the annual PUA calculation.
Trawling tracks
Swept Area Ratio (SAR)
Percentage Unfished Area (PUA)
Trawling tracks
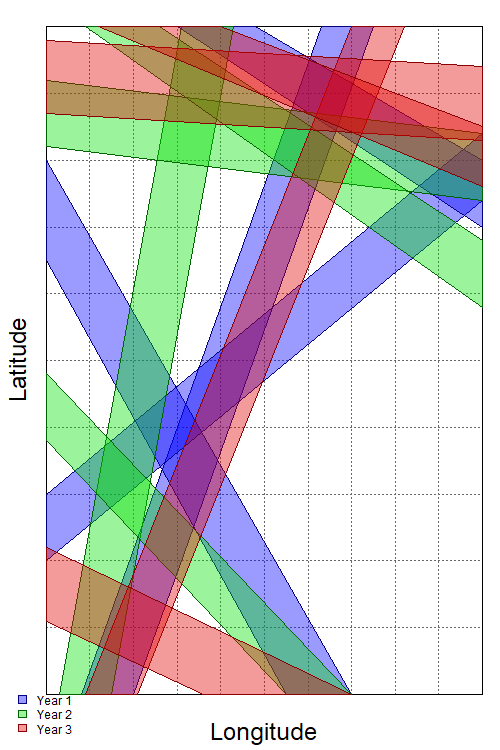
The hypothetical example that was used in the descriptions of the SAR and PUA calculation has been expanded so that it now includes fishing tracks from three consecutive years, depicted in blue (year 1), green (year 2), and red (year 3).
Swept Area Ratio (SAR)
For each year, we have determined the Swept Area Ratio (SAR) based on the fishing tracks of that year. Although some of the fishing tracks overlap, it is clear that the exact locations of the fishing tracks differ between years.
Percentage Unfished Area (PUA)
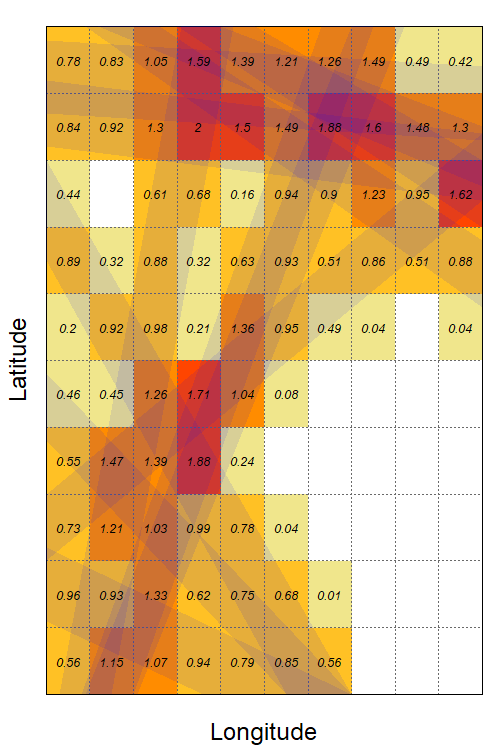
We determine the multi-year footprint by selecting the highest annual SAR value observed within the assessed period, for each grid cell. This assumes that fishing activity in grid cells that are partially fished for multiple years (annual SAR<1), is limited to the proportion (area) of the grid cell affected in the year with the highest SAR-value. Grid cells that are fully fished (annual SAR = 1) at least once during the multi-year period, contribute as completely fished in the multi-year footprint.
Conclusions
In this hypothetical example, the multi-year PUA estimate is 40.5%, which means that 40.5% of the seabed has not been touched by fishing gear in the entire period.
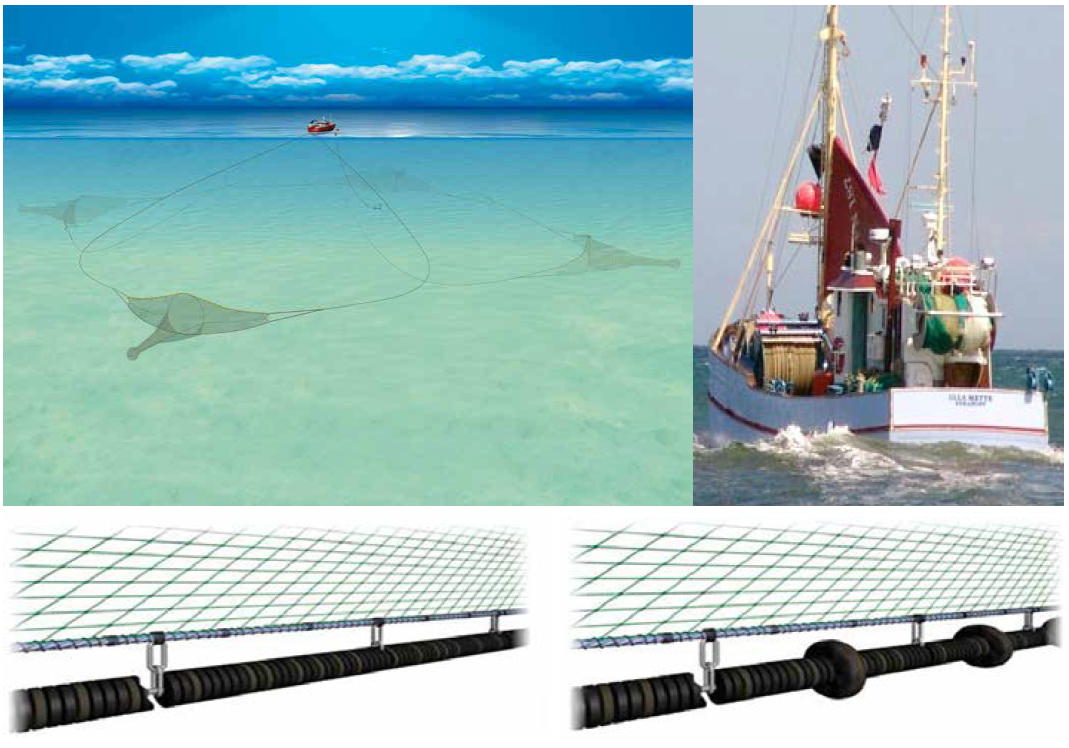
This website shows all the bottom-towed gears that are used by Danish fishermen in Danish waters. They have in common that the fishing gear (parts of it) are actively towed over the bottom. Their design and dimensions, however, span a wide array of different gear types ranging from beam trawlers to otter trawlers to Scottish and Danish seines. We have grouped certain gears together based on their similarities. You can find more information on these gear groups here.
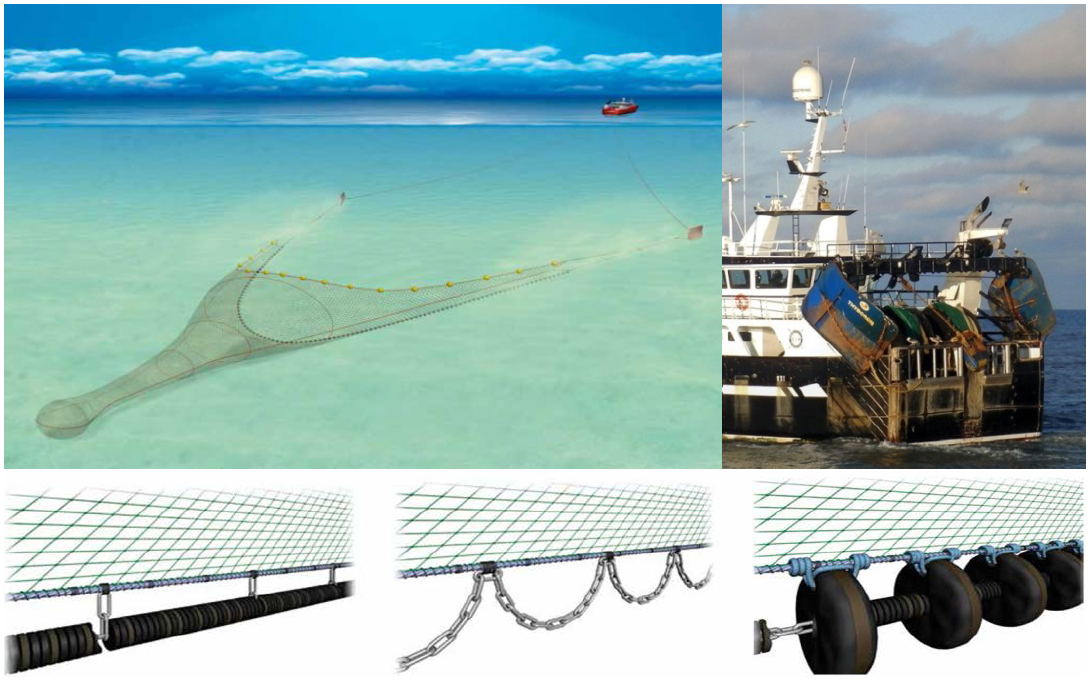
Otter trawls are named after the so-called otter boards (trawl doors) that maintain the horizontal opening of the net. These boards are attached to the vessel with ropes, and to the fishing nets with sweeps. In the picture of the fishing vessel on the left, you can see the (blue) otter boards hanging on the side of the vessel. These boards are designed in such a way they remain in contact with the floor, while the water ‘pushes’ the boards outwards during the towing, keeping the trawl net open horizontally. The vertical opening of the trawl net is obtained by equipping the head rope with floats, while the ground rope (fishing line) is made heavier to ensure bottom contact. The ground rope is often also equipped with (rubber) discs, chains, or bobbins, to prevent the net from being damaged by contact with the seafloor. Their exact shape and size depends on the target species and the habitat type of the fished area. (Lower drawings; left, middle, and right respectively).
The otter trawls are divided into 6 different groups based on their main target species:
Otter trawls specifically targeting Norway lobster (Nephrops norvegicus) are linked to specific “Nephrops fishing grounds”, where the gear is adjusted for these typically muddy areas, for instance by the usage of light ground gear. This “pure” nephrops fishery is mostly located in Kattegat. In addition, a multi-rig gear is often used to increase gear width without using more engine power. Vessels deploying multi-rig gears have multiple trawl nets between the otter boards. In between the different nets, a clump weight is added to ensure bottom contact. Often the Nephrops fishery additionally targets a mix of demersal fish such as cod, plaice, lemon sole and monkfish. This is mostly the case in the North Sea and Skagerrak and here the fishery is less confined to muddy grounds and the ground gears more heterogenous.
Otter trawl fishing for deep-water shrimp (Pandalus borealis) takes place almost exclusively in the deep part of the Skagerrak and the easternmost part of the North Sea. Despite a relatively low effort, the intensity of fishing is therefore relatively high in the limited area where fishing takes place. The trawling takes place on soft bottom in deep water with large and heavy otter boards and relatively light ground gear.
Otter trawls targeting demersal fish are widespread and can be used in single-species fisheries targeting plaice or cod, but most frequently fishermen catch a mix of several demersal fish species, depending on location and season. This type of otter trawl is often fished on different sediment types and the ground gear adjusted accordingly with e.g., the use of bobbins or rockhoppers.
The otter trawl fishery targeting Norway pout (NOP) takes place on even, mostly soft bottom and is primarily localized to Fladen ground in the North Sea. The trawl gear is designed so that both otter boards, sweeps, and ground gear have bottom contact.
Otter trawls targeting sandeel (Ammodytes marinus) are linked to specific sandbanks, mainly in the North Sea, where this species can be caught in dense shoals off the bottom during the 2nd quarter of the year. The trawl gear is often designed so that only the ground gear and parts of the sweeps are in contact with the seabed, while the otter boards are towed slightly above the seabed.
Otter trawls targeting small pelagic fish like sprat and herring are widespread and are deployed on different types of generally smooth sediments. The trawls are often designed so that only the ground gear, which is generally relatively light, and parts of the sweeps are in contact with the seabed, while the otter boards are towed slightly above the seabed.
Otter trawls targeting sandeel (Ammodytes marinus) are linked to specific sandbanks, mainly in the North Sea, where this species can be caught in dense shoals off the bottom during the 2nd quarter of the year. The trawl gear is often designed so that only the ground gear and parts of the sweeps are in contact with the seabed, while the otter boards are towed slightly above the seabed.
Otter trawl fishing for deep-water shrimp (Pandalus borealis) takes place almost exclusively in the deep part of the Skagerrak and the easternmost part of the North Sea. Despite a relatively low effort, the intensity of fishing is therefore relatively high in the limited area where fishing takes place. The trawling takes place on soft bottom in deep water with large and heavy otter boards and relatively light ground gear.
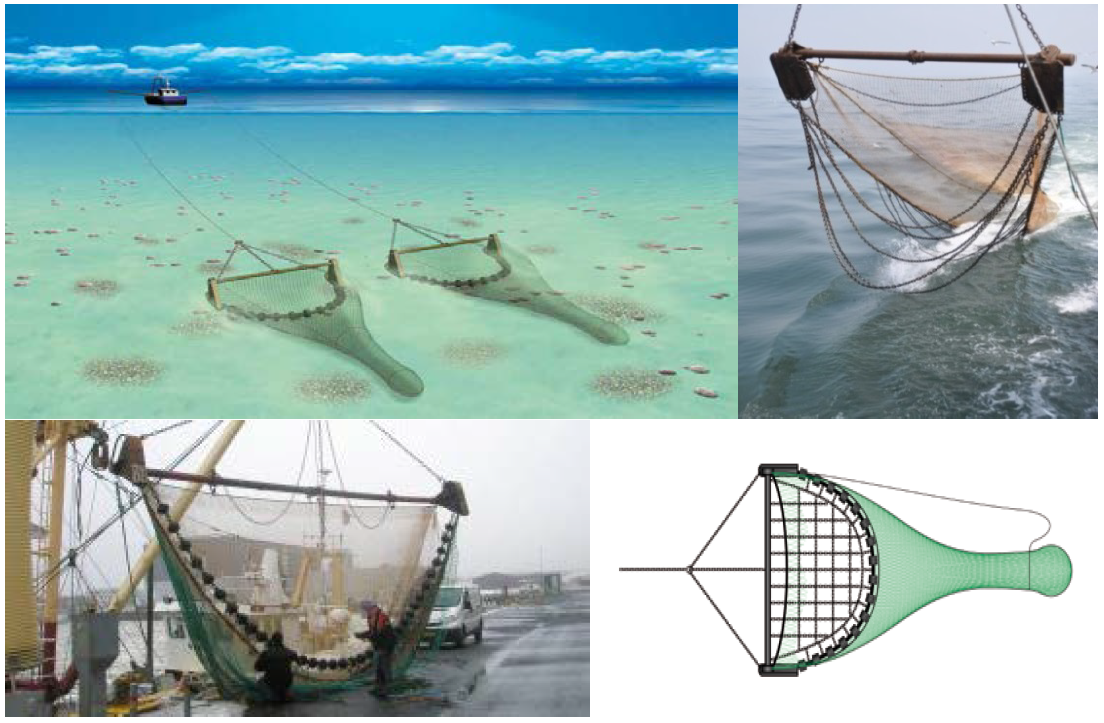
Beam trawls targeting brown shrimp are used in coastal waters, as that is where the brown shrimp are dominantly present. This fishing gear is adjusted to the relatively small crustaceans, with shorter beams (around 4 m), smaller trawl nets, light-weight ground gears, and smaller mesh sizes than the beam trawls used for demersal fish.
Beam trawls targeting demersal fish often catch a variety of species, but primarily target flatfishes such as plaice, sole, turbot and lemon sole.
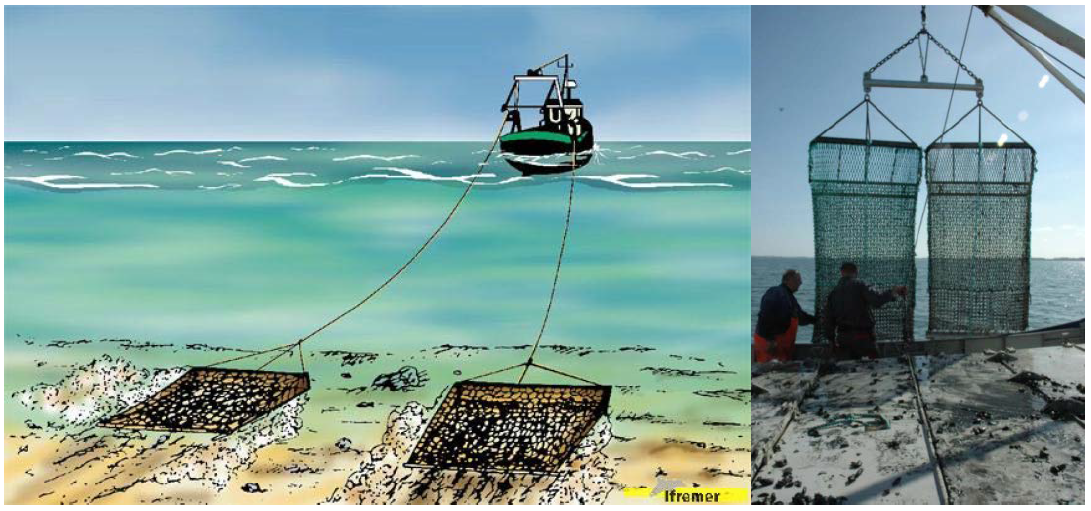
Dredges are fishing gear specifically aimed to target bottom-dwelling shellfish, such as cockles, blue mussels, and oysters. It consists of a heavy steel frame, with a trawl net made partly of chain meshes and partly of very thick and strong nylon netting. The dredge is towed over the seafloor and collects the targeted shellfish in the net.